2025 GEFRI finds wide readiness gaps and a global innovation bottleneck
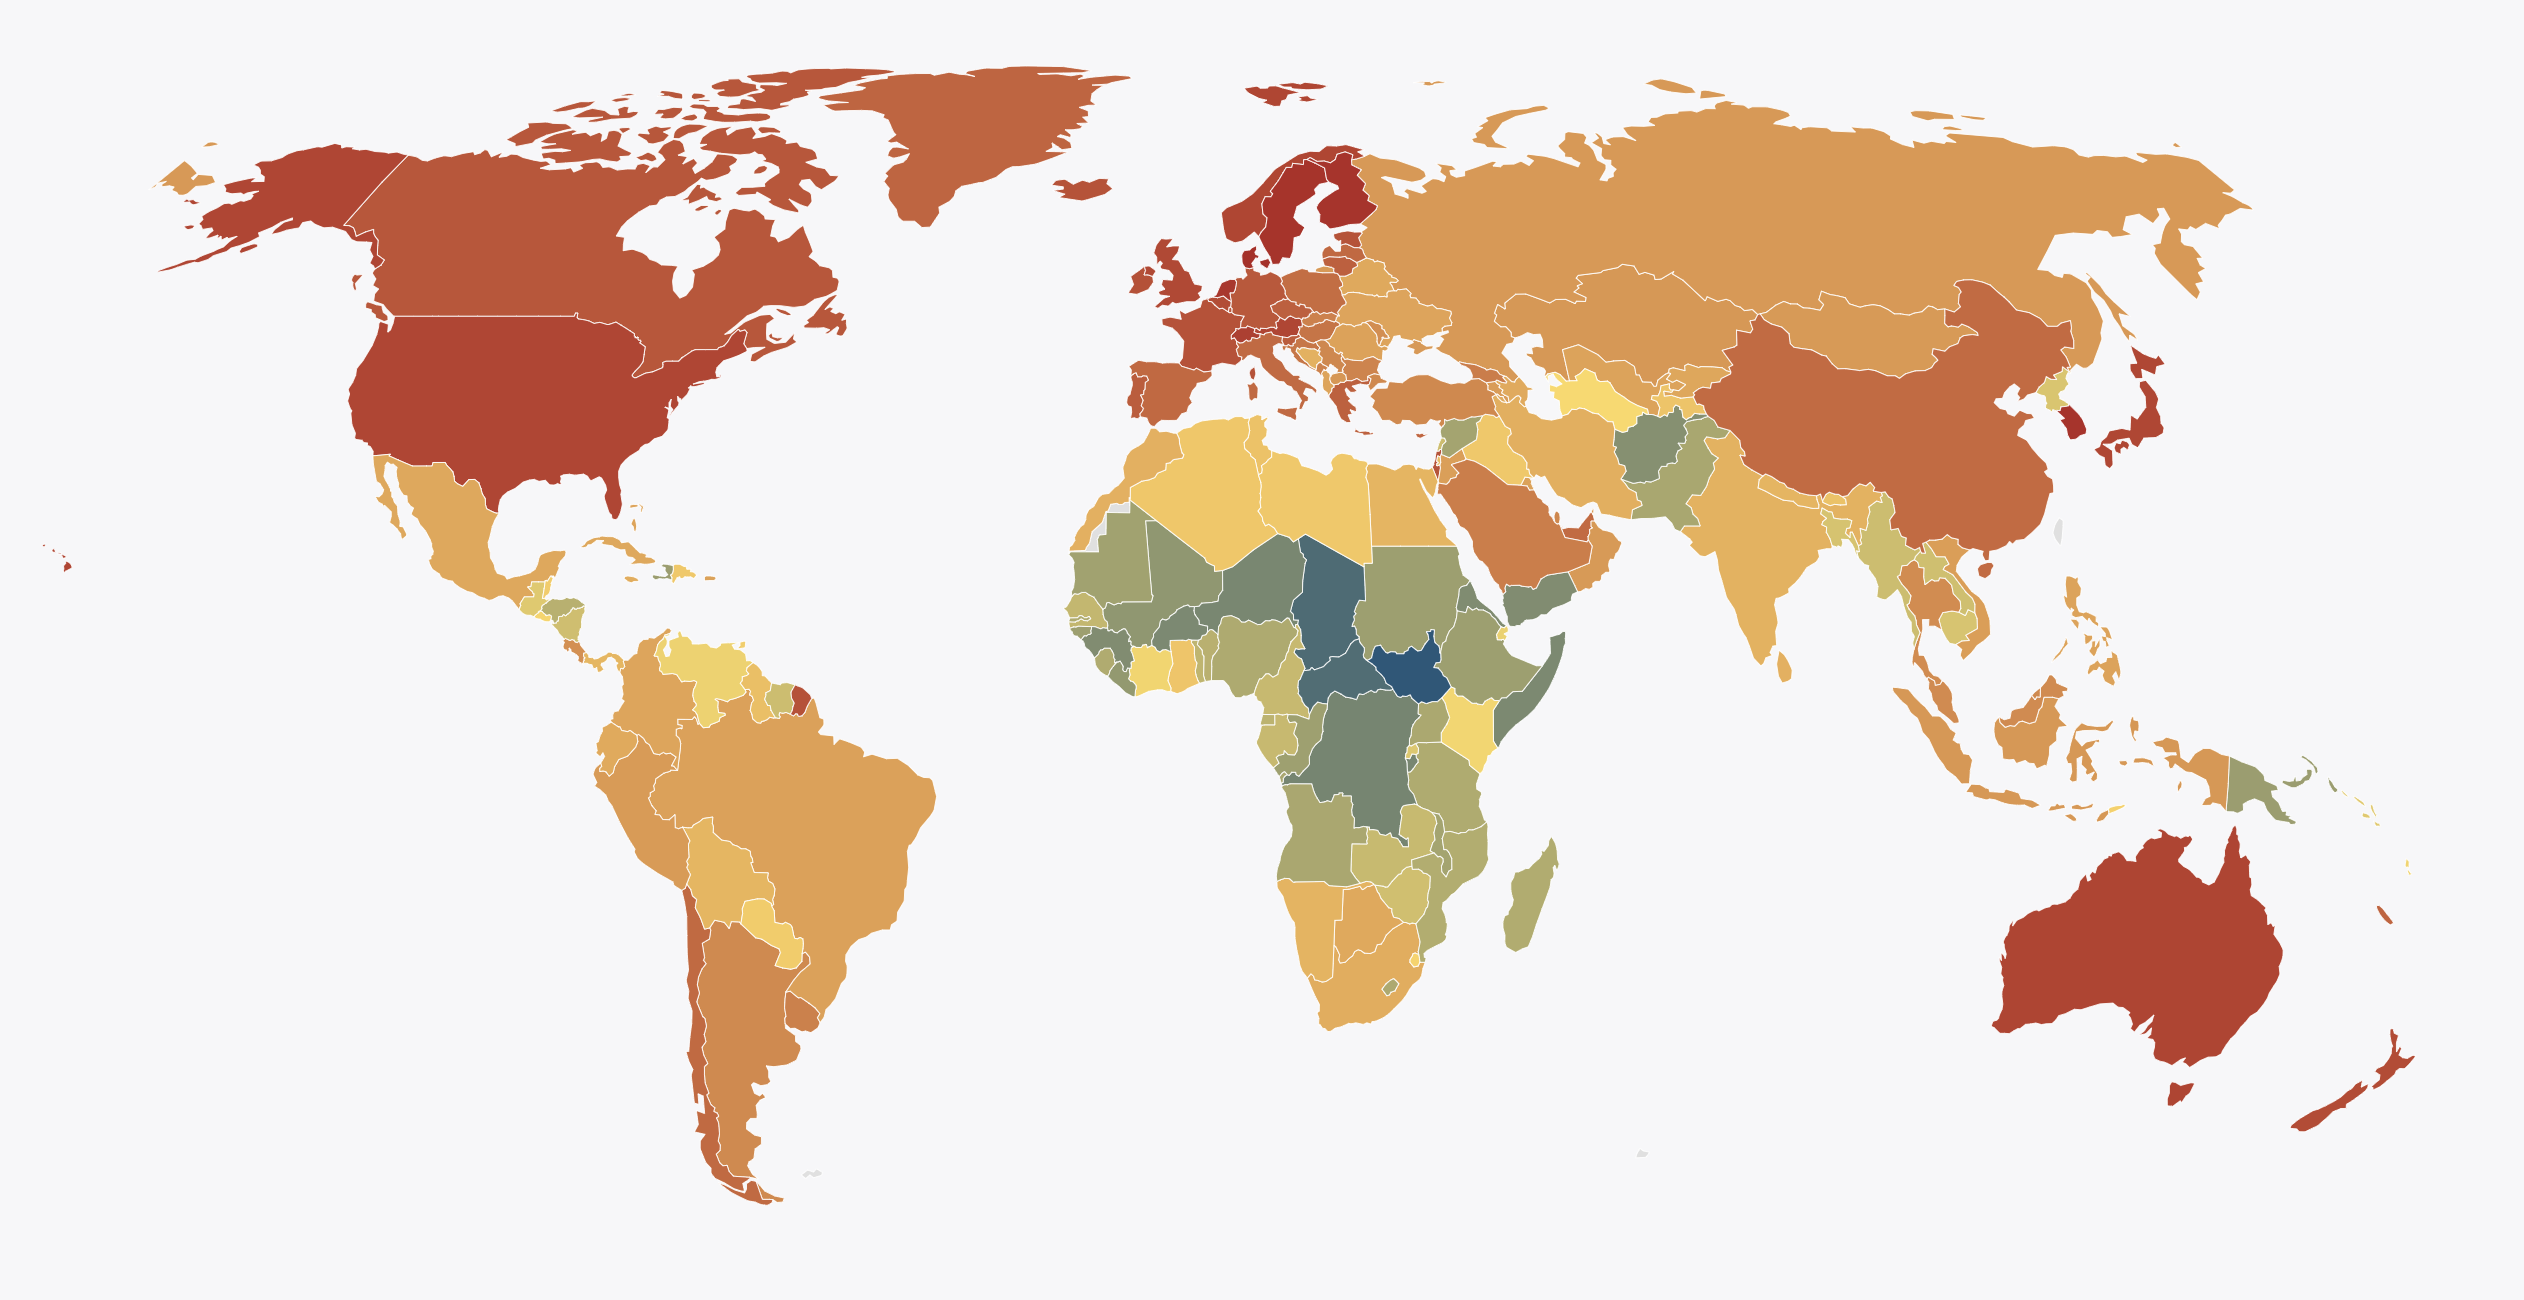
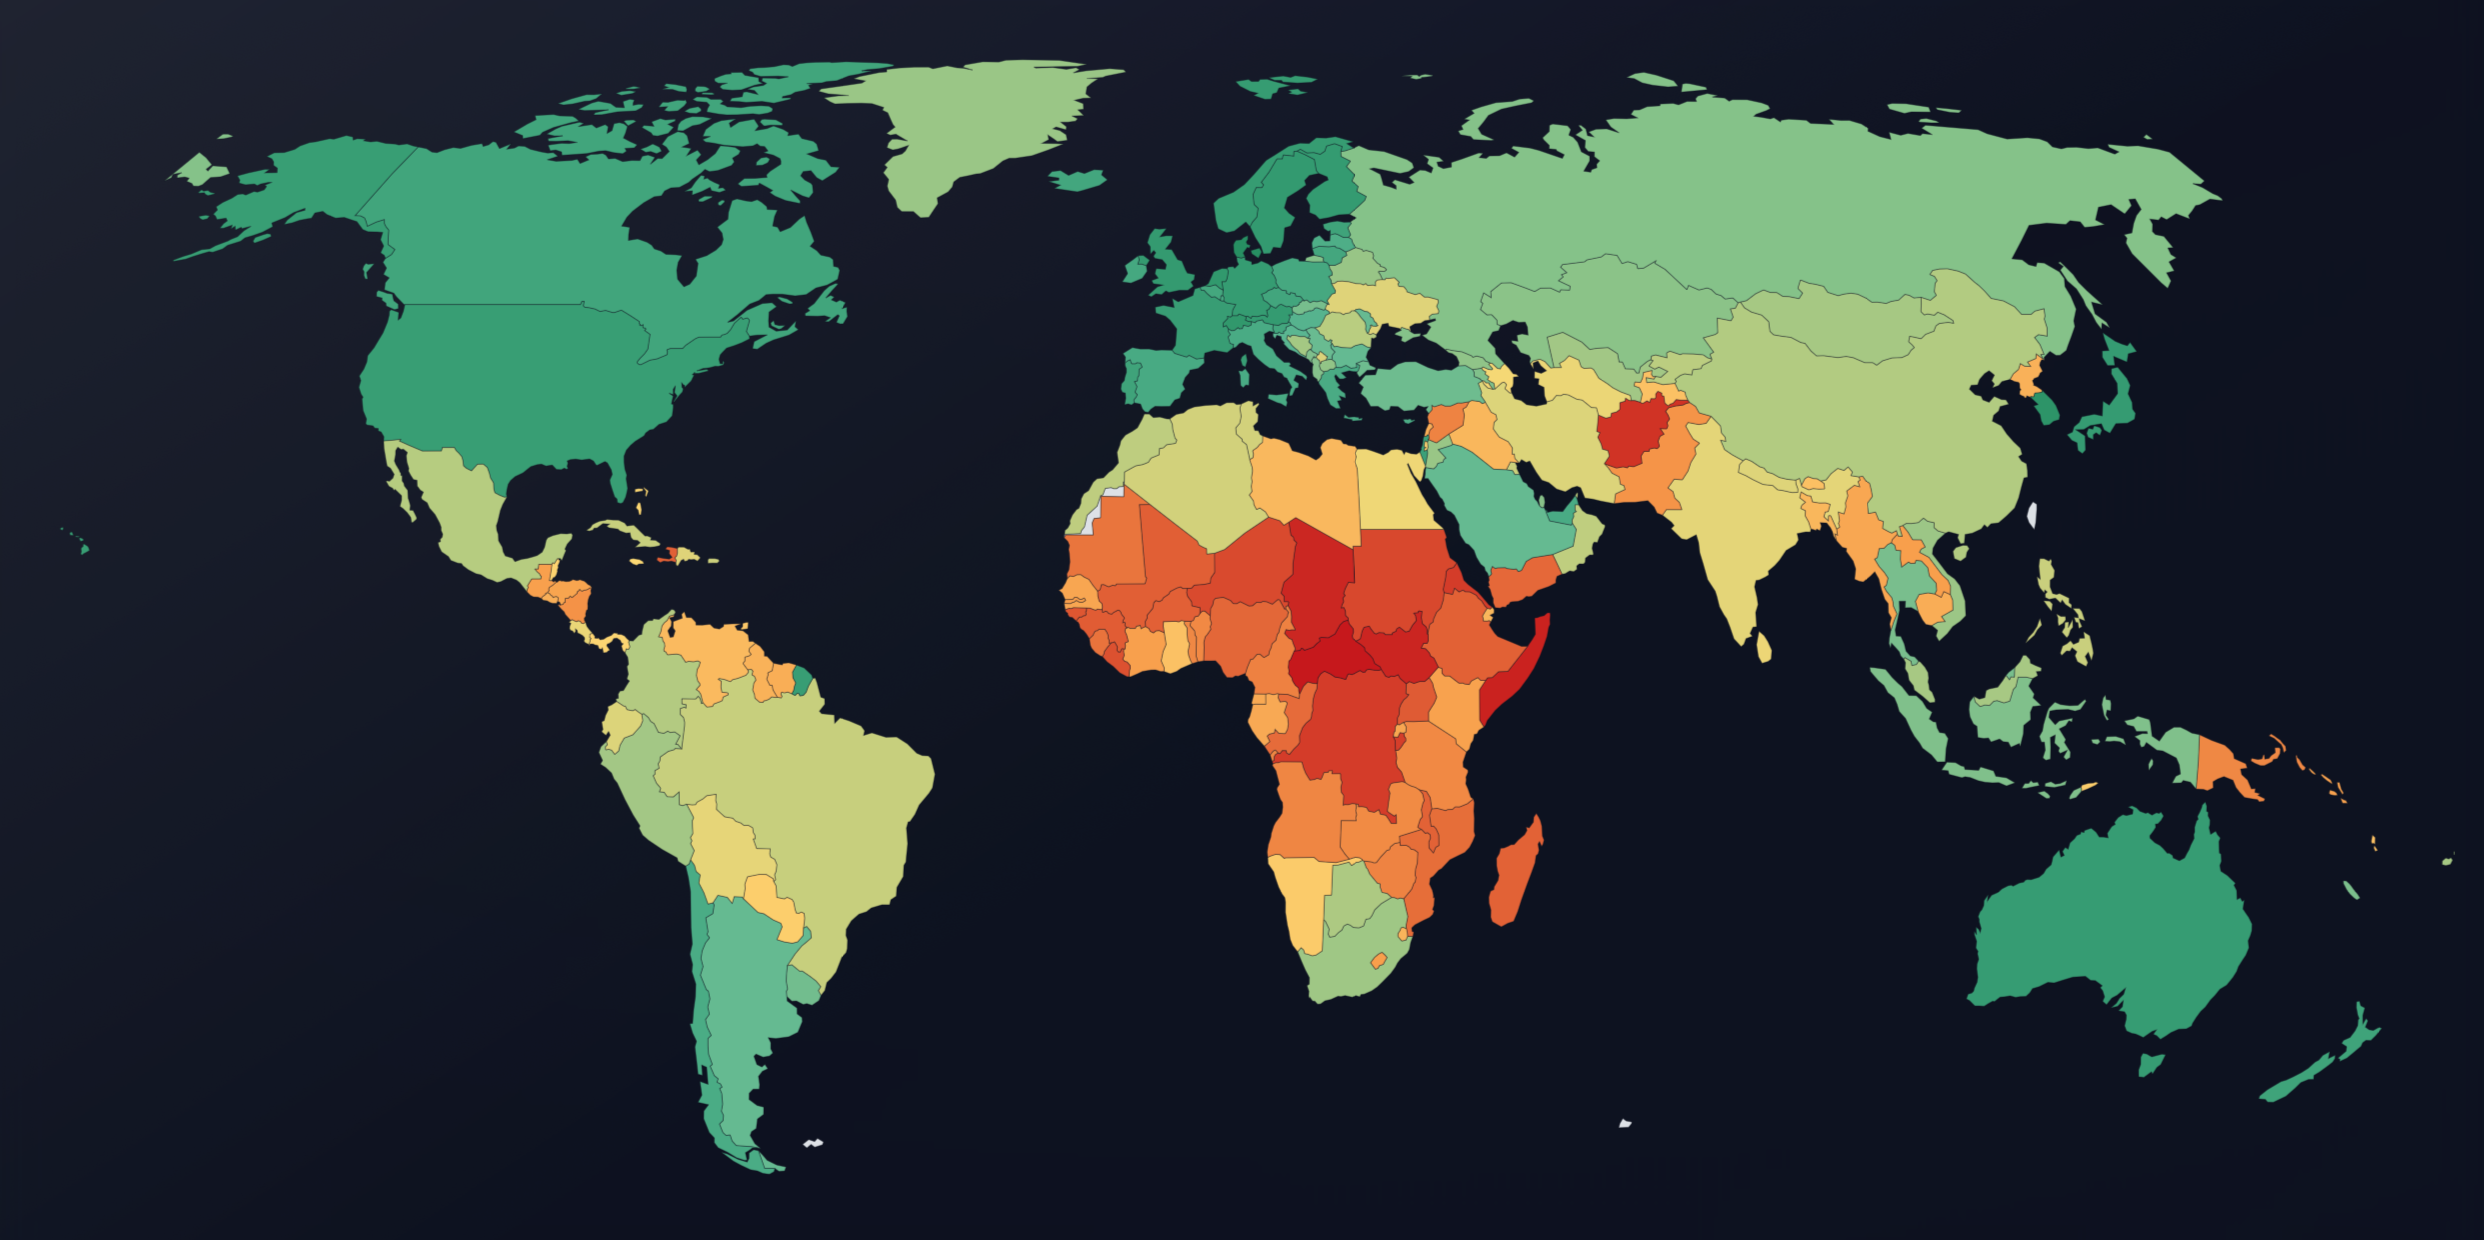
The Global Education Futures Readiness Index (GEFRI) 2025 end-of-year snapshot shows a world that remains unevenly prepared for education futures. Across 177 non-microstate countries, the global average GEFRI score is 48.85 (on a 0–100 scale), with a range from 13.56 to 81.98 and a standard deviation of 17.00, indicating large variation across systems (data are current as of December 1, 2025).
GEFRI benchmarks readiness across five dimensions: Infrastructure, Human Capital, School Access and Gender Parity, Innovation, and Governance. The interactive tool is available at gefri.educationfutures.com.
At the top of the index, Denmark leads at 81.98, with Korea close behind at 79.60. Singapore (78.63), Switzerland (78.09), the Netherlands (77.84), Hong Kong SAR, China (77.86), and Sweden (77.30) also sit in the top tier. These countries show strength across multiple dimensions at once, which is important because shocks rarely arrive one at a time. Energy price spikes, demographic change, migration, climate disruption, and rapid diffusion of generative AI can stress infrastructure, workforce capacity, and governance in the same year. High performers tend to sustain public capability, align incentives, and translate strategy into implementation.
At the other end of the rankings, the lowest scores cluster in conflict-affected and high-fragility contexts where systems face compounding constraints. The Central African Republic posts the lowest score (13.56), followed by Somalia (14.87) and South Sudan (15.30). Other very low performers include Chad (15.58) and the Democratic Republic of the Congo (18.44). In these settings, low readiness reflects intertwined barriers: weak or damaged infrastructure, interrupted access to schooling, constrained teacher supply and training, and limited state capacity to plan, finance, and deliver reforms. When these constraints reinforce each other, “catch-up” becomes harder because each gain depends on progress in the others.

GEFRI also shows a large middle tier where progress remains possible but not guaranteed. Many countries have built basic coverage and expanded access, yet they struggle to convert those gains into resilient learning outcomes and future-ready capability. This is where policy coördination becomes increasingly critical. Systems in this range can improve quickly when they treat reform as an implementation discipline, focus on binding constraints, and sustain effort across electoral cycles.
The distribution underscores the stakes. Readiness shapes whether schools can keep teaching during crisis, whether teachers can use new tools without undermining rigor, and whether students can move from schooling into decent work. It also shapes whether emerging technologies, including generative AI, reduce workload through better design and support, or instead widen inequality through uneven access, uneven teacher capacity, and uneven governance of quality and ethics. In practical terms, readiness affects learning loss, labor productivity, and social trust.
Key global findings (December 2025 snapshot)
- Global leaders cluster at the top, but no country nears a score of 90.
The top 10 countries by composite score are: Denmark (81.98), Korea, Rep. (79.60), Singapore (78.63), Switzerland (78.09), Hong Kong SAR, China (77.86), Netherlands (77.84), Sweden (77.30), United Kingdom (77.03), Finland (76.87), and Austria (76.82). - Many systems remain in critically low-score bands.
Among 177 countries, GEFRI scores fall into these bands: ≤30: 38 countries (21.5%); 31–45: 34 (19.2%); 46–60: 53 (29.9%); 61–75: 36 (20.3%); 76–90: 16 (9.0%); >90: 0 (0.0%). - Innovation is the most common binding constraint.
When countries are assessed across Infrastructure, Human Capital, Innovation, and Governance, the most frequent lowest-performing dimension is Innovation (70 countries; 39.5%), followed by Governance (53; 29.9%), Human Capital (46; 26.0%), and Infrastructure (8; 4.5%). This pattern suggests many systems have expanded access and basic capacity faster than they have built the institutions, incentives, and talent pipelines that support sustained invention and scaling. - Regional gaps remain large.
Average composite scores by region are: North America 74.10; Europe & Central Asia 65.85; East Asia & Pacific 55.04; Middle East & North Africa 50.57; Latin America & Caribbean 46.72; South Asia 40.68; Sub-Saharan Africa 28.31. - Fragility tracks a major readiness penalty.
Countries flagged as fragile, conflict-affected, or violence-affected average 26.68, compared with 53.93 for non-FCV countries, a gap of 27.25 points.
What policy leaders can learn from GEFRI going into 2026
This snapshot points to a pragmatic lesson: continue investments into what works, then raise the binding constraint. In many countries, that means pairing investment in tools and connectivity with reforms that grow innovation capacity and strengthen governance for implementation, while rebuilding human capital pipelines that education systems and labor markets both trust.
“GEFRI shows that readiness is not a single investment,” said GEFRI creator, Dr. John Moravec. “Many systems built pieces of the future, but they did not yet build the ability to adapt at speed. Countries will gain the most by identifying their binding constraint and treating it as a national delivery problem to leapfrog ahead, not a pilot project.”
About GEFRI
GEFRI is an open benchmarking index built from globally comparable indicators, with documented methods for data cleaning, imputation, scoring, and confidence adjustments. It draws primarily on World Bank and UNESCO-linked sources, with attribution tracked in indicator metadata and the technical appendix. GEFRI flags microstates (population under 300,000) so they do not anchor global reference statistics, and it uses a structured approach to cleaning, imputing missing values, and producing dimension and composite scores.
GEFRI is a completely open, free, and transparent tool. Data are also available through a public, no-authentication API, including access to historical snapshots when available.