

New data shows persistent readiness gaps
The mid-2026 update of the Global Education Futures Readiness Index (GEFRI) provides a comparative view of how well national education systems are positioned to respond to social, technological, economic, and institutional change.
GEFRI illustrates this readiness through a composite score from 0 to 100. The score combines results across five dimensions: infrastructure, human capital, school access and gender parity, innovation, and governance. A higher score indicates that a country has developed stronger and more balanced conditions across these areas. A lower score indicates that major constraints remain in one or more parts of the system. The composite score does not measure the quality of individual schools, teachers, or learners, nor does it predict future performance. It provides a common benchmark of the broader conditions that support an education system’s capacity to adapt.
In each mid-year update, GEFRI recalculates the preceding four years, incorporating observations that the World Bank and other international agencies have revised, validated, or added after their initial publication. This rolling update gives policymakers a more complete account of recent trends while preserving a consistent basis for comparison.
The midyear update also introduces two new tools: Insights and the GEFRI Map Explorer. Insights brings the principal global and regional findings together through accessible summaries, comparisons, and visual analysis. The Map Explorer allows users to examine composite and dimension scores across countries and regions. Together, the tools help policymakers, researchers, and education leaders move from broad comparisons toward focused questions about where readiness gaps occur, how systems differ, and which constraints merit closer attention.
This release also introduces GEFRI scoring engine 1.2, with revisions that improve the consistency, transparency, and treatment of incomplete data across the index. In particular, this has impacted how the dimensions of School Access & Gender Parity and Human Capital are calculated. To preserve comparability, GEFRI has recalculated all scores from 2016 onward using the revised methodology.
In the mid-2026 update, the data show that education futures readiness remains limited across much of the world, progress is uneven across the conditions that support readiness, and large gaps persist between countries and within national systems.
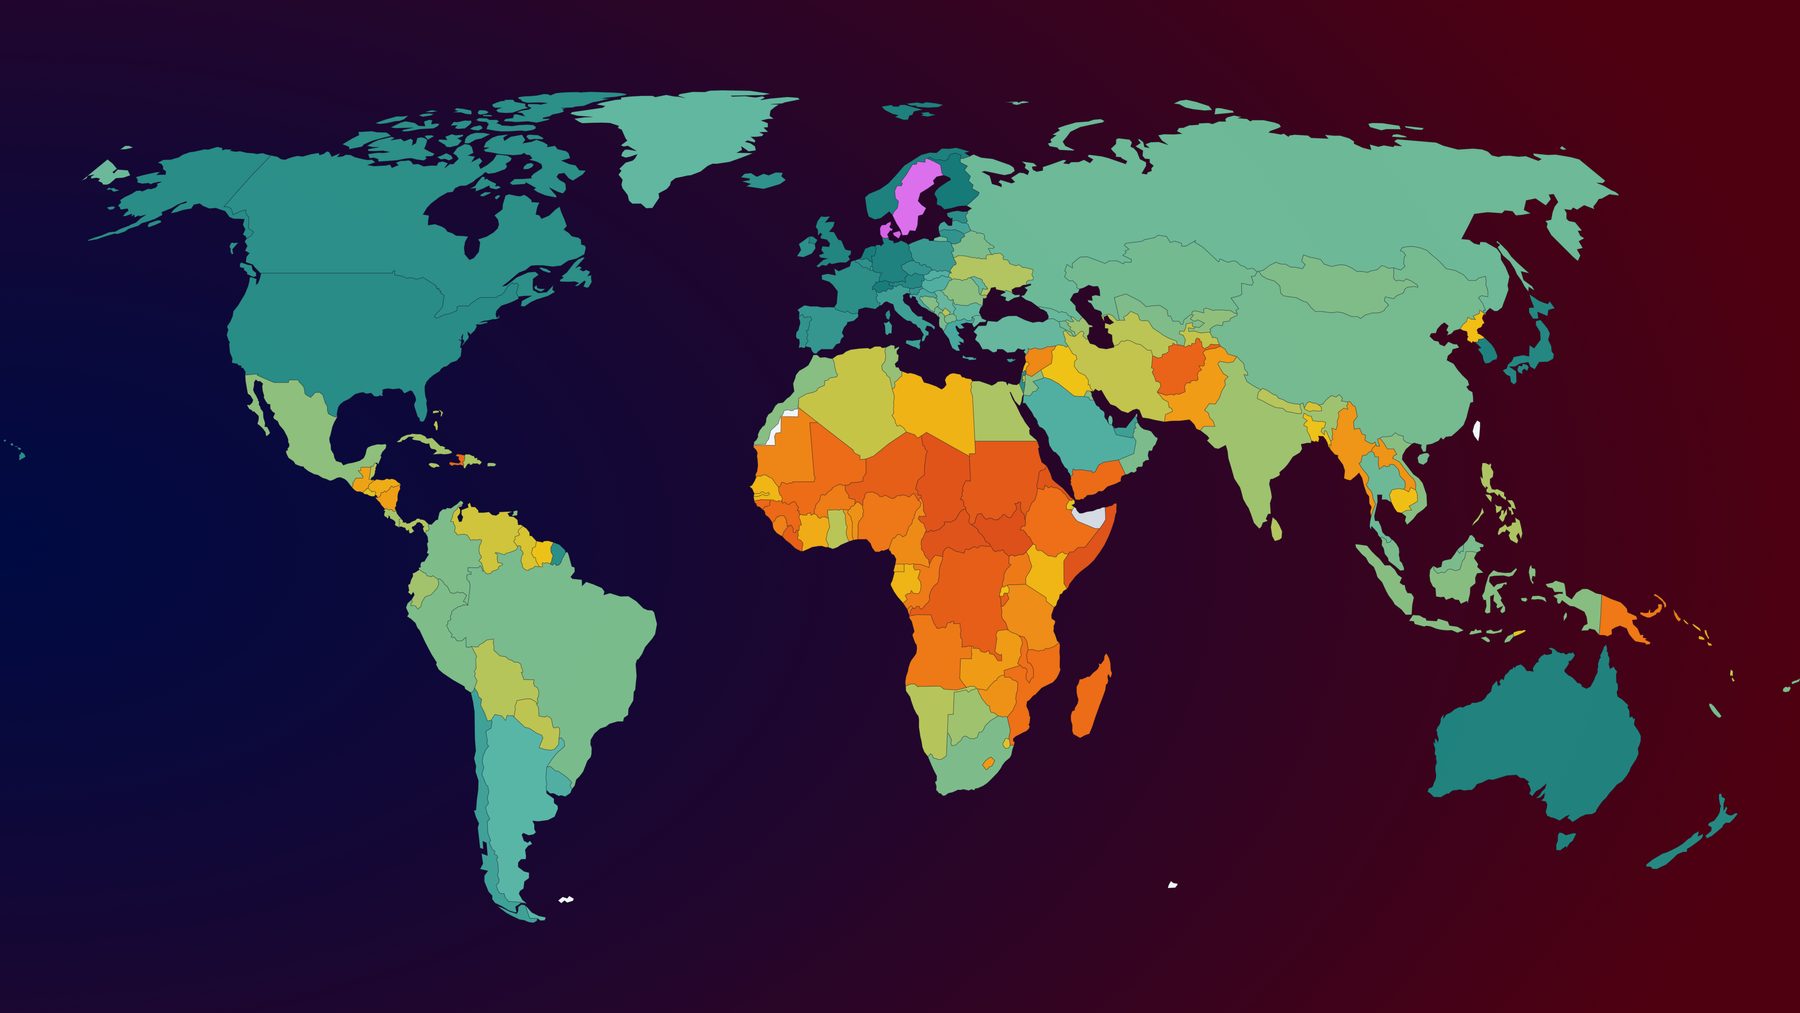
Map of GEFRI composite scores (click on a country to explore its profile):
Most education systems remain below advanced readiness
The updated index covers 217 countries and jurisdictions. The global average GEFRI score is 59.78 out of 100, while the median country scores 63.56.
95 countries remain below the progressing readiness threshold of 60 points. These countries represent 2.35 billion of the world’s population.
This means that most people live in countries where education systems have not yet developed sufficiently across infrastructure, human capital, school access and gender parity, innovation, and governance.
GEFRI measures the broader conditions that allow education systems to prepare for change. A country may have successful institutions or programs while still facing national constraints that limit its ability to extend those successes across the system. However, at the national level, only Denmark and Sweden have reached the GEFRI target of 90 points. Even countries with advanced readiness continue to face gaps that require policy attention.
Futures readiness depends on balance, not strength in one area
The composite GEFRI score provides a useful overview, but it does not tell the whole story. The five dimension scores show where a system has built capacity and where unresolved constraints may limit its ability to respond to change.
Across the updated dataset, 65.9% of countries have a difference of at least 30 points between their strongest and weakest dimensions. In practical terms, this indicates these systems have developed substantial capacity in some areas while leaving major gaps elsewhere.
Country profiles make these differences visible. Nepal, for example, records a strong result in school access and gender parity, at 97.97 points, but a much lower innovation score of 35.04. This suggests that broad participation in education has not yet been matched by the research capacity, investment, and knowledge-production systems needed to support sustained adaptation. Nepal’s profile shows why gains in access provide a foundation for readiness, rather than its completion.
Argentina presents a different pattern. Its strong school access and gender parity result, at 94.24, sits well above its innovation and governance scores, both near 50. The country has developed substantial educational participation and human-capital capacity, yet weaker innovation and institutional conditions may make it harder to convert those assets into coördinated, long-term change. The policy challenge is therefore less about creating educational participation from the beginning and more about connecting that participation to stable governance, research, and implementation capacity.
Imbalance also appears among higher-performing systems. In the United States, school access and gender parity score of 94.65, while human capital scores at 82.05. Strong innovation, governance, and technological capacity raise the country’s overall result, but the lower human-capital score indicates that access to secondary and tertiary completion, literacy, and the development of population-wide capabilities remain constraints. A high composite score can therefore coëxist with weaknesses that affect who can participate in and benefit from future-oriented change.
These cases show why no single investment can establish futures readiness on its own. Strength in one dimension may produce limited results when weaknesses elsewhere prevent institutions and learners from making full use of it.
The findings therefore point toward balanced system development. Policymakers should use the composite score to understand a country’s overall position, then examine its dimension profile to identify the constraint most likely to slow further progress. The goal is not to make every dimension identical, but to prevent one weak part of the system from limiting the value of strengths built elsewhere.
Infrastructure continues to outpace innovation
In 83.4% of countries, infrastructure is markedly stronger than research and innovation capacity. This remains one of the clearest patterns in the index.
Many countries have expanded electricity, connectivity, mobile access, and secure digital services. These investments provide an essential foundation for modern education. Yet access to technology does not by itself create the capacity to adapt, produce knowledge, or develop new solutions.
GEFRI global infrastructure scores:
Macao SAR, China provides a clear example. Its infrastructure score stands at 89.04, while its innovation score is 27.25, a gap of over 60 points. The territory combines widespread connectivity with strong human capital and governance, but its underlying indicators suggest that limited research investment and research capacity contribute to its lower innovation result. The pattern illustrates how a system can develop the means to use technology without building comparable capacity to shape its development.
Panama shows a similar pattern at a different level of readiness. Its infrastructure score of 81.64 is nearly twice its innovation score of 40.61. Electricity, connectivity, and digital access provide a base for future development, but the underlying indicators suggest that lower research investment and research capacity limit experimentation and local knowledge production. Strengthening universities and research institutions could help Panama convert its infrastructure gains into a broader capacity for innovation.
The pattern also appears where infrastructure itself remains limited. In the Gambia, infrastructure scores 57.90, compared with an innovation score of 25.14. Neither dimension has reached a high level of readiness, but connectivity and electrical infrastructure have advanced further than the research systems needed to create and adapt new technologies. This case shows that countries do not need to complete their infrastructure development before investing in innovation capacity. Both can develop together, with universities, researchers, and technical institutions helping determine how new infrastructure serves national priorities.
GEFRI’s innovation dimension examines research investment, research personnel, scientific production, and high-technology exports. Across these cases, the gap suggests that countries can often adopt and consume new technologies more readily than they can shape, evaluate, or produce them.
GEFRI global innovation scores:
For policymakers, this distinction carries direct consequences. Investment in devices and connectivity should connect with investment in universities, research systems, technical expertise, local knowledge production, and the capacity to assess emerging technologies. Without these links, education systems may depend on solutions designed elsewhere and have less influence over how those solutions affect teaching, learning, and public policy.
Fragility compounds existing readiness constraints
Fragile and conflict-affected situations continue to score below other countries across all five GEFRI dimensions.
The average composite score among these countries is 29.3, compared with 54.2 among countries outside this group. The difference of 24.9 points reflects overlapping constraints, including disrupted educational delivery, limited institutional capacity, damaged infrastructure, restricted public resources, and difficulty sustaining long-term planning.
South Sudan illustrates how these pressures can affect an entire system. Its composite score is 18.91, with particularly low results in infrastructure, governance, and school access and gender parity. Limited electricity and connectivity restrict the reach of digital education, while weak institutional capacity makes it difficult to coördinate reform or sustain services. The profile suggests that isolated interventions will have limited effect unless they form part of a broader effort to rebuild access, public institutions, and basic infrastructure.
Afghanistan presents another form of systemwide constraint. Its infrastructure score is higher than several of its other dimensions, but very low results in human capital, innovation, governance, and school access and gender parity pull the overall score down to 23.36. The pattern shows how some physical capacity can remain in place even as restrictions on participation, weak institutions, and limited knowledge production reduce the education system’s ability to use it. For policymakers and international partners, educational continuity must therefore include access, particularly for excluded learners, as well as support for teachers, institutions, and local expertise.
Lebanon shows why fragile and conflict-affected settings should not be treated as a uniform group. The country retains comparatively stronger infrastructure and innovation capacity, but governance scores much lower. Its composite score of 43.40 reflects a system with meaningful assets that cannot reach their full value under conditions of institutional and fiscal instability. In such cases, policy should protect existing capacity while strengthening the institutions needed to coördinate, finance, and sustain it.
These examples also show that fragility does not produce policy problems that require universal solutions. In South Sudan, the most urgent constraints extend across basic access, infrastructure, and governance. In Afghanistan, exclusion and weak human-capital development compound institutional limits. In Lebanon, the challenge lies in preserving established capabilities while restoring the conditions needed to use them coherently.
International support should therefore connect immediate educational continuity with longer-term institutional development. It should also account for data limitations. Countries affected by conflict and institutional disruption often report data less regularly, while rapid changes on the ground may outpace the available indicators. GEFRI flags estimated values and provides confidence information so users can distinguish stronger evidence from results that should be treated as a limited signal. Country profiles should inform further inquiry, rather than serve as complete assessments of conditions in fragile settings.
Loading GEFRI data…
The composition of the comparison group also warrants scrutiny. Venezuela does not appear on the World Bank’s FY27 public list of fragile and conflict-affected situations, despite the country’s continuing institutional, economic, and social crisis. Its absence should not be interpreted as evidence that these conditions have been resolved. Rather, it illustrates a limitation of any classification that reduces complex forms of fragility to a fixed list of qualifying cases.
International classifications carry policy and financial consequences, and the criteria used to include or exclude countries deserve public examination. Venezuela’s omission raises legitimate questions about how institutional fragility is defined, which conditions are recognized, and how political considerations may shape international classifications. The available public documentation does not establish that any particular government directed the decision, so GEFRI treats the omission as a methodological and policy concern rather than attributing a motive that cannot yet be documented.
Historical revisions improve the policy picture
International datasets do not remain fixed after publication. Countries submit new information, statistical agencies validate earlier reports, and the World Bank may add observations to previous years.
For this reason, each GEFRI midyear update recalculates the latest results and the preceding four years. The 2026 release therefore incorporates newly available observations and revisions across this five-year window.
A revised historical score does not always mean that conditions in a country changed after the fact. In some cases, it means that the available evidence describing those conditions has improved.
This distinction matters when policymakers evaluate progress. A trend should be interpreted alongside the underlying indicators, the dates of those observations, and the confidence level assigned to each dimension. The data transparency built into GEFRI provides these details to help users distinguish a meaningful change in system conditions from a change caused by revised or more complete reporting.
Moving from comparison to diagnosis
GEFRI is most useful as a starting point for policy inquiry. It can show where a country stands in relation to regional and income peers, but its greater value comes from identifying the questions that should follow.
Which readiness dimension is holding the system back? Does the country have the institutional capacity to make use of its infrastructure? Are gains in access shared across different groups of learners? Is innovation capacity growing alongside the adoption of imported technologies? Do apparently strong results rely on complete and current data?
The GEFRI website provides several tools for examining these questions:
-
A new, interactive map allows users to compare composite and dimension scores across countries.
-
Country profiles show areas of progress, areas of concern, raw indicator data, and data-confidence information for each dimension.
-
The Insights dashboard presents global distributions, regional comparisons, internal readiness gaps, and patterns affecting fragile and conflict-affected situations. This includes a summary of implications for policymakers.
-
The Data page allows users to review and download current and historical results.
-
The open API supports independent research, dashboards, and other applications.
GEFRI is not intended to replace national statistics, local knowledge, or detailed system diagnostics. Rather, it offers a common frame through which policymakers can identify patterns, compare experiences, and direct attention toward the readiness conditions that require deeper analysis.
The mid-2026 update reinforces a central policy lesson: preparing education systems for the future requires more than isolated improvements. It requires sustained progress across the institutions, infrastructure, people, innovation systems, and commitments to inclusion that allow education to adapt.
Explore the updated results, compare country profiles, and examine the underlying dimensions through the GEFRI website: https://gefri.educationfutures.com